
The table below provides insight into various
education indicators of Pakistan including gross enrollment ratio, adjusted net
enrollment ratio, effective transition rate, literacy rate and youth literacy
rate
Indicators
|
Male
|
Female
|
Total
|
GPI
|
|
Gross Enrollment Ratio (GER) -
Pre-Primary
|
79%
|
69%
|
74%
|
0.87
|
|
Gross Enrollment Ratio (GER)- Primary
Classes: 1-5
|
105%
|
90%
|
97%
|
0.86
|
|
Gross Enrollment Ratio (GER)- Middle
Classes: 6-8
|
60%
|
50%
|
55%
|
0.84
|
|
Gross Enrollment Ratio (GER)-
Secondary Classes: 9-12
|
39%
|
30%
|
34%
|
0.77
|
|
Adjusted Net Enrolment Ratio (ANER) –
Primary Classes 1-5
Age Group: 5-9
|
83%
|
71%
|
77%
|
0.86
|
|
Adjusted Net Enrolment Ratio (ANER) –
Middle Classes 6-8
Age Group: 10-12
|
53%
|
45%
|
49%
|
0.84
|
|
Adjusted Net Enrolment Ratio (ANER) –
Secondary Classes 9-10
Age Group: 13-16
|
36%
|
28%
|
32%
|
0.78
|
|
Survival Rate to Grade-5
|
67%
|
65%
|
66%
|
0.96
|
|
Effective Transition Rate (ETR)
Primary to Middle
|
82%
|
81%
|
82%
|
0.98
|
|
Effective Transition Rate (ETR)
Middle to Secondary
|
94%
|
90%
|
92%
|
0.96
|
|
Literacy Rate (Age 10 years and
older)
|
70%
|
49%
|
60%
|
0.70
|
|
Youth Literacy (Age Group 15-24 years)
|
81%
|
64%
|
72%
|
0.79
|
|
Education Indicators of Pakistan
Source: Pakistan Education
Statistics 2015-16 - AEPAM
Region
|
Male
|
Female
|
Total
|
Pakistan
|
105%
|
90%
|
97%
|
Punjab
|
110%
|
104%
|
107%
|
Sindh
|
90%
|
70%
|
81%
|
KP
|
127%
|
95%
|
112%
|
Balochistan
|
72%
|
43%
|
59%
|
AJK
|
77%
|
75%
|
76%
|
FATA
|
111%
|
59%
|
86%
|
GB
|
85%
|
80%
|
83%
|
ICT
|
130%
|
129%
|
130%
|
Gross Enrolment Ratio (GER) in
Primary Education (%)
Source: Pakistan Education
Statistics 2015-16 - AEPAM
The Table
below provides gender-wise GER in secondary education in different regions of
the country
Region
|
Male
|
Female
|
Total
|
Pakistan
|
47.7%
|
38.6%
|
43.3%
|
Punjab
|
49.8%
|
47.6%
|
48.8%
|
Sindh
|
36.8%
|
28.7%
|
33.0%
|
KP
|
69.8%
|
33.2%
|
52.1%
|
Balochistan
|
21.5%
|
12.2%
|
17.2%
|
AJK
|
48.7%
|
41.5%
|
45.2%
|
FATA
|
34.7%
|
8.1%
|
21.8%
|
GB
|
44.1%
|
35.1%
|
39.6%
|
ICT
|
92.1%
|
92.1%
|
92.1%
|
Gross Enrolment Ratio (GER) in
Secondary Education (%)
Source: Pakistan Education Statistics 2015-16 - AEPAM
The
Figure below shows the GPI of GER primary. FATA shows the worst GPI of GER in primary.
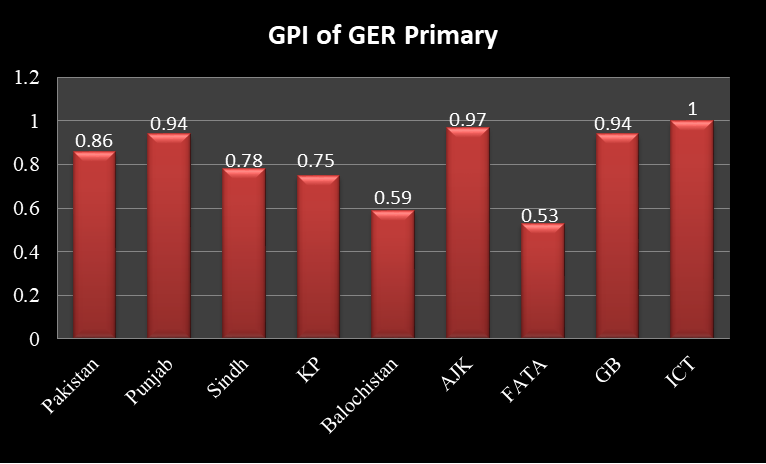
GPI of GER Primary
Source: Pakistan Education
Statistics 2015-16 - AEPAM
The GPI of GER secondary
is provided below. GPI shows unequal distribution in provinces such as
Balochistan, KP and FATA.
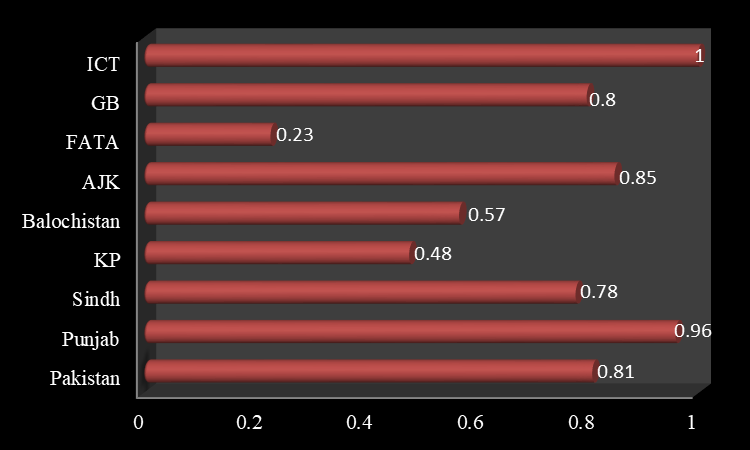
GPI of GER Secondary (Lower and
Upper)
Source: Pakistan Education Statistics 2015-16 - AEPAM
The
Table below shows the percentage of female teachers at various levels of
education in different provinces of Pakistan. The highest percentage can be observed
in the ICT region followed by Punjab
Percentage of Female Teachers
Source: Pakistan Education
Statistics 2015-16 - AEPAM
Region
|
Male
|
Female
|
Total
|
Pakistan
|
108.4%
|
94.1%
|
101.5%
|
Punjab
|
108.0%
|
102.9%
|
105.5%
|
Sindh
|
106.5%
|
82.8%
|
95.2%
|
KP
|
130.4%
|
108.9%
|
120.0%
|
Balochistan
|
90.2%
|
48.2%
|
70.5%
|
AJK
|
70.4%
|
68.5%
|
69.5%
|
FATA
|
115.5%
|
76.0%
|
96.5%
|
GB
|
57.6%
|
55.5%
|
56.6%
|
ICT
|
118.3%
|
120.5%
|
119.4%
|
Gross Intake Rate
(GIR) in Primary
Source: Pakistan Education Statistics 2015-16 - AEPAM
The percentage of female enrolment
at various levels of education in different provinces of Pakistan is provided in
the Table below
Region
|
Pre-Primary
|
Primary
|
Middle
|
Upper Secondary
|
Pakistan
|
44.6%
|
44.2%
|
43.6%
|
42.1%
|
Punjab
|
46.7%
|
46.9%
|
47%
|
48.3%
|
Sindh
|
42.6%
|
41.3%
|
42.5%
|
40.5%
|
KP
|
44.6%
|
41.1%
|
34.7%
|
25.9%
|
Balochistan
|
32.5%
|
34.2%
|
34.0%
|
31.5%
|
AJK
|
47.7%
|
48.0%
|
47.7%
|
41.2%
|
GB
|
41.4%
|
46.8%
|
41.9%
|
40.2%
|
FATA
|
35.5%
|
33.3%
|
18.7%
|
16.1%
|
ICT
|
47.1%
|
47.5%
|
47.2%
|
47.6%
|
Percentage of Female Enrolment
Source: Pakistan Education Statistics
2015-16 - AEPAM
The Table below shows the
gender-wise enrolment at public and private sector universities at different
provinces of Pakistan. The highest female enrolment can be seen at Bachelor
level
|
Level
|
Public
|
Private
|
Total
|
||||||
Pakistan
|
Male
|
Female
|
Total
|
Male
|
Female
|
Total
|
Male
|
Female
|
Total
|
|
Bachelor
|
455,283
|
364,224
|
819,507
|
85,544
|
68,436
|
153,980
|
540,827
|
432,660
|
973,487
|
|
Master of 16 years of Education
|
107,058
|
85,646
|
192,704
|
20,115
|
16,093
|
36,208
|
127,173
|
101,739
|
228,912
|
|
Master
of 16 + years
|
60,593
|
48,474
|
109,067
|
11,386
|
9,109
|
20,495
|
21,979
|
57,583
|
129,562
|
|
PhD
|
7,018
|
5,613
|
12,631
|
1,319
|
1,054
|
2,373
|
8,337
|
6,667
|
15,004
|
|
PGD
|
4,061
|
3,249
|
7,310
|
763
|
611
|
1,374
|
4,824
|
3,860
|
8,684
|
|
Universities (Public + Private)
Enrolment by Province Gender and Level
Source: Pakistan Education
Statistics 2015-16 - AEPAM
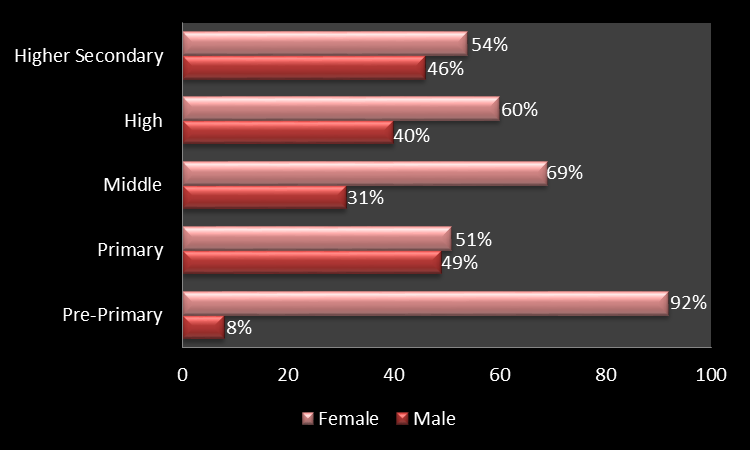
The
Figure below shows the gender-wise distribution of enrolment in %age at
different levels. The highest number of female enrolment is seen at pre-primary
level followed by primary level
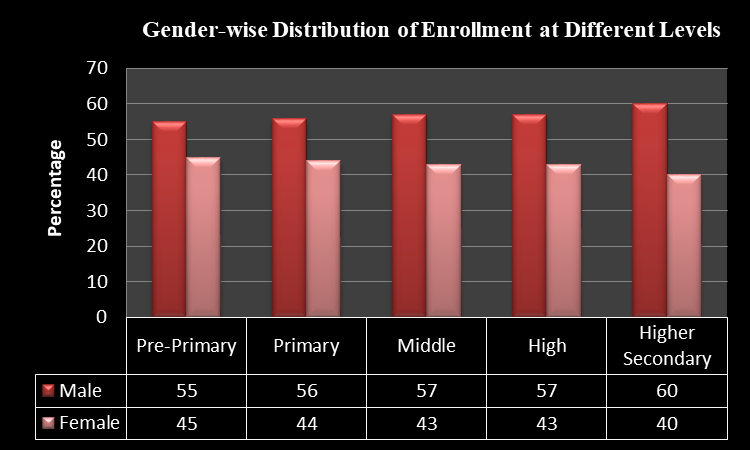
Gender wise Distribution of
Enrolment at Different Levels (in %)
Source: Pakistan Education
Statistics 2015-16 - AEPAM
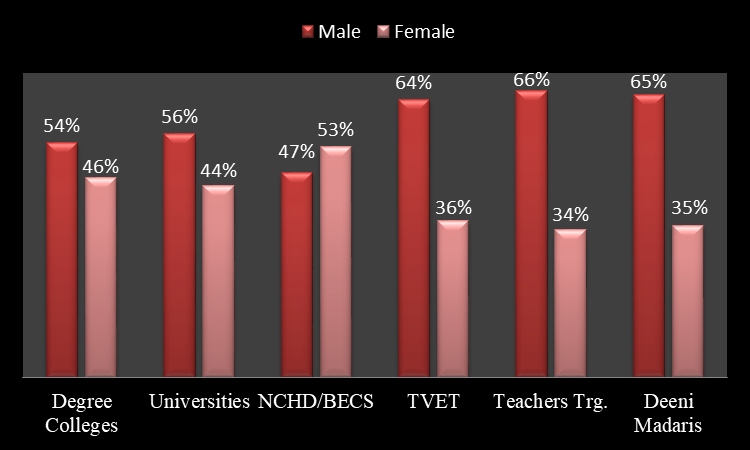
The gender-wise distribution of teachers is shown
below. The highest percentage of female teacher distribution can be observed at
pre-primary level
Gender wise Distribution of
Teachers (in %)
Source: Pakistan Education
Statistics 2015-16 - AEPAM
Gender wise Distribution of
Enrolment (in %)
Source: Pakistan Education
Statistics 2015-16 - AEPAM
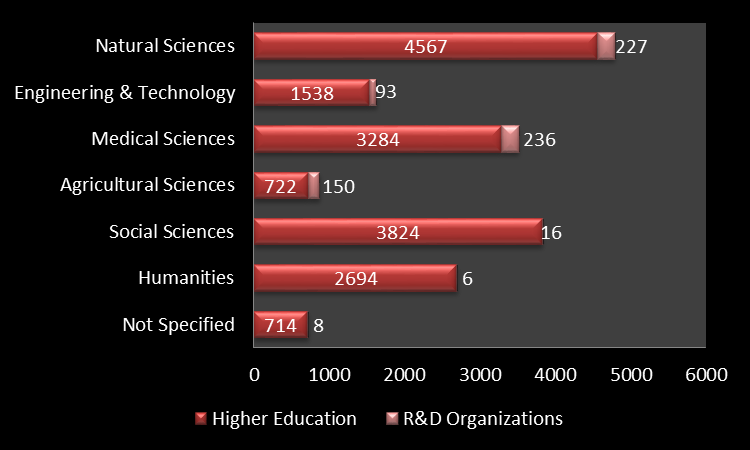
Number of Female Researchers
(headcount) by Field of Science and Sector of Employment (2013)
Source: PCST R&D Survey 2013-14
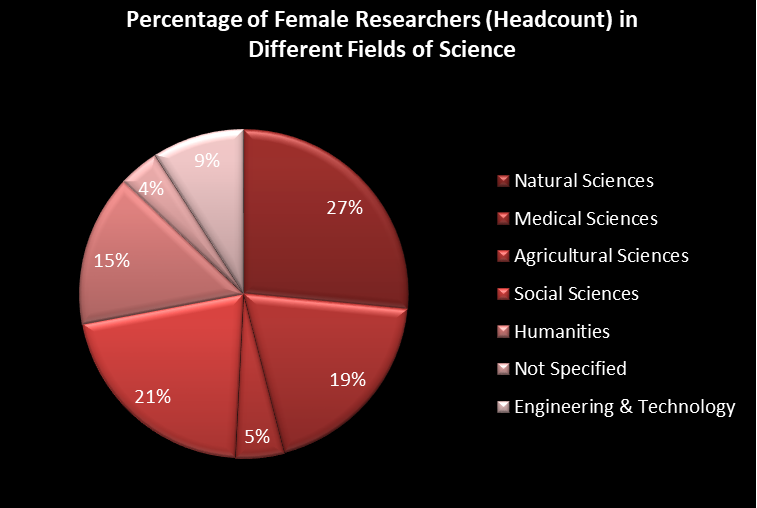
Percentage
of Female Researchers (headcount) in Different Fields of Science (2013)
Source:
PCST R&D Survey 2013-14
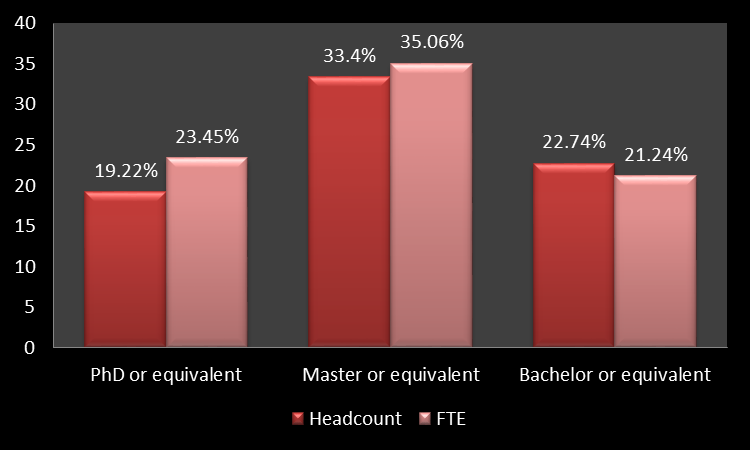
Percentage
of Female Researchers (headcount and full-time equivalent) in Different Qualification
Levels (2013)
Source:
PCST R&D Survey 2013-14